
All explainers · Agent-based simulation, explained
Individual agents: groups and single persons
Animation paused (reduced motion). Press play to watch.
In one sentence
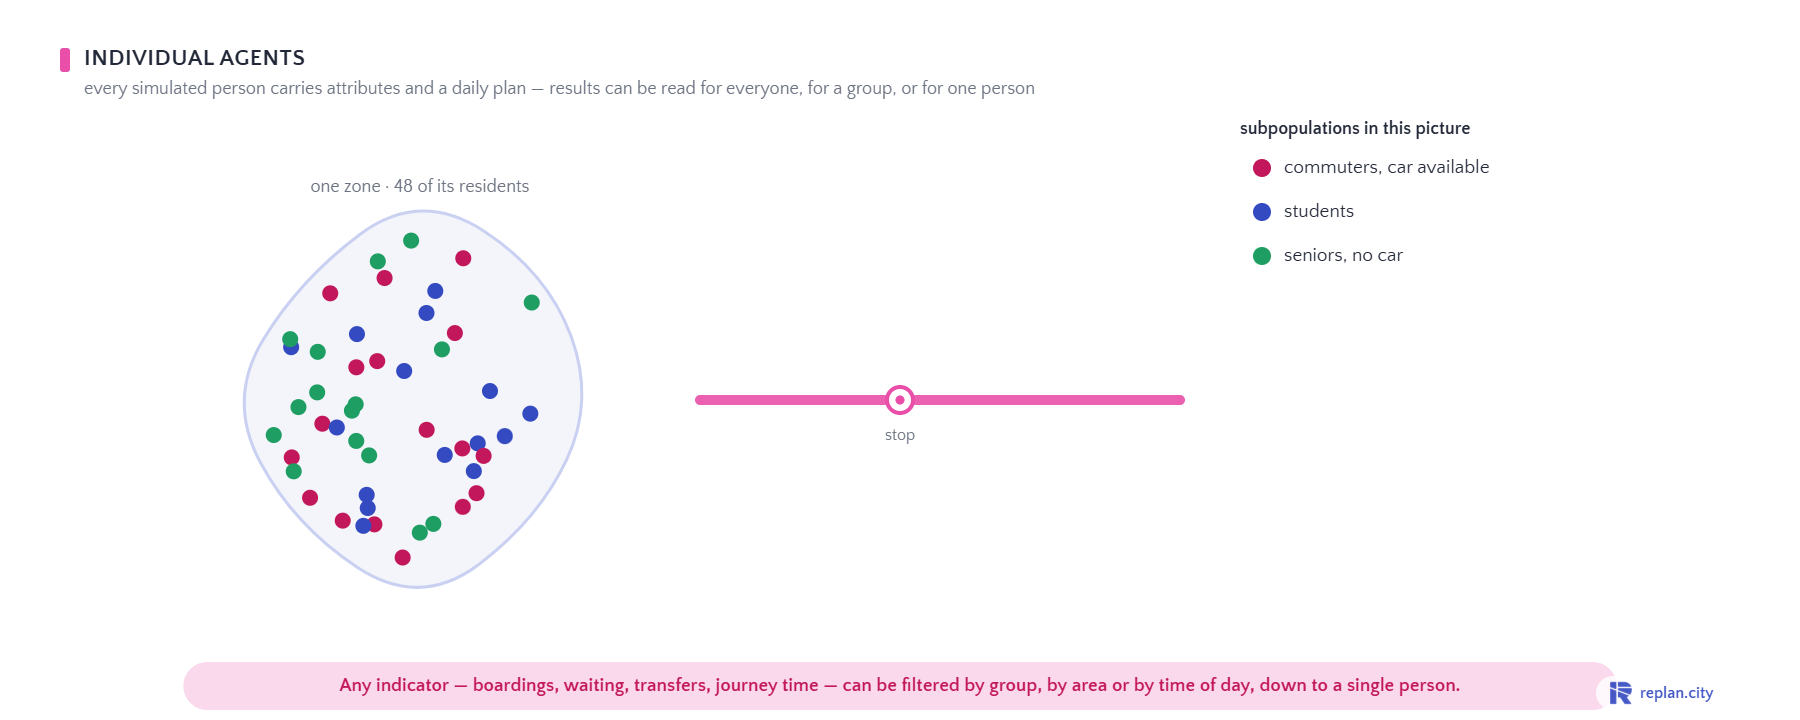
Any indicator can be filtered by group, by area or by time of day, down to a single person.
Why it matters
Every simulated person carries attributes and a daily plan. Results can therefore be read for everyone, for a subpopulation — commuters with a car, students, seniors without one — or for one person: their journeys, their waiting, their transfers.
Agent-based simulation is usually explained with equations or with a screenshot of a running model. Neither shows why a planner should care. These explainers show the mechanism itself — one person, one day, one score — so that the results on a dashboard stop being a black box.
Sources
- Schematic illustration; values are illustrative
What you see
- 00.0One zone, 48 residents
- 02.4Subpopulations
- 03.6Three persons and their attributes
- 09.0Filter: students
- 11.8Filter: seniors
- 15.0Takeaway
Use this explainer
Poster (PNG) · MP4 / GIF: rendered on request
Embed: <iframe src="https://www.replan.city/explains/embed/individual-agents?lang=en" width="900" height="360" style="border:0;max-width:100%;aspect-ratio:5/2" loading="lazy" title="Individual agents: groups and single persons"></iframe>
Paste into any page; the explainer plays as live SVG (no video file).
Licence: CC BY 4.0 — reuse freely with the line “Replan GmbH · replan.city/explains”. The Replan mark in the corner stays.
More: Comparison with Replan
See it on your own network
Book a demoRelated explainers
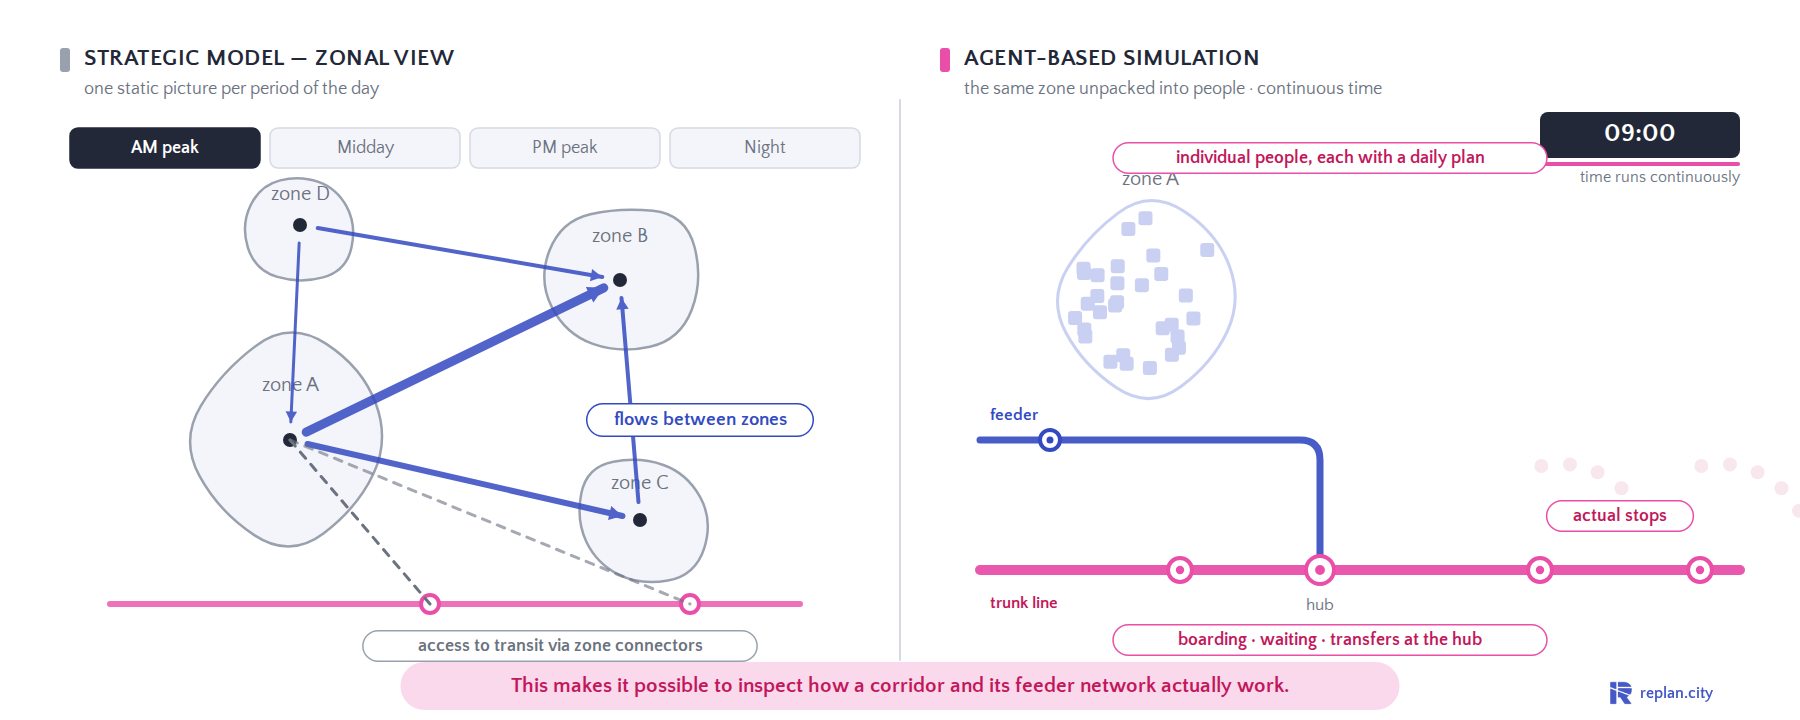
From zonal flows to individual journeys
This makes it possible to inspect how a corridor and its feeder network actually work.
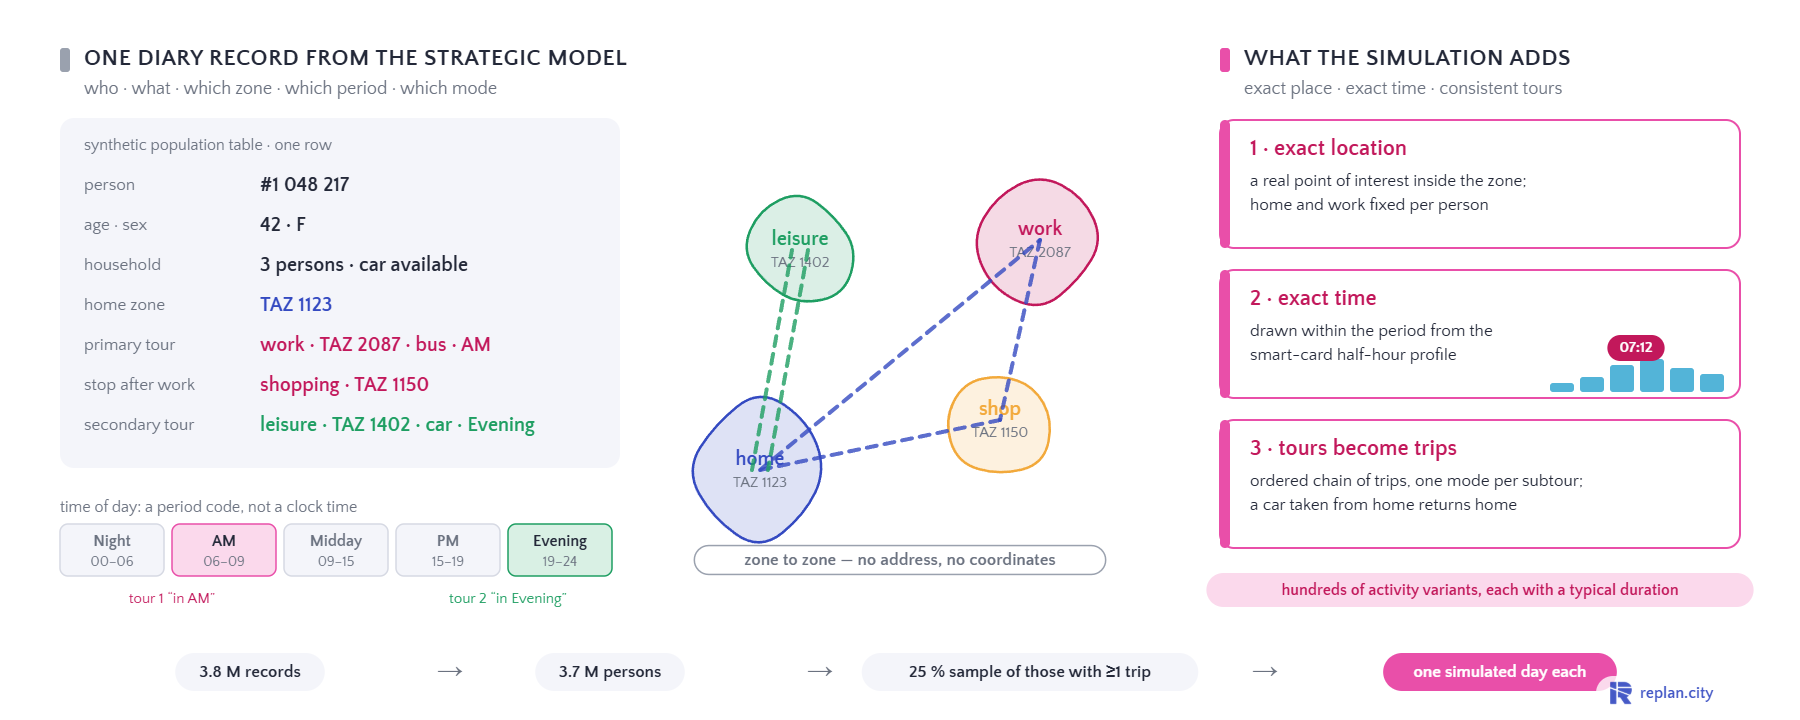
From a diary record to a simulated day
The strategic model supplies who, what, which zone and which period; the simulation adds exact place, exact time and consistent tours.
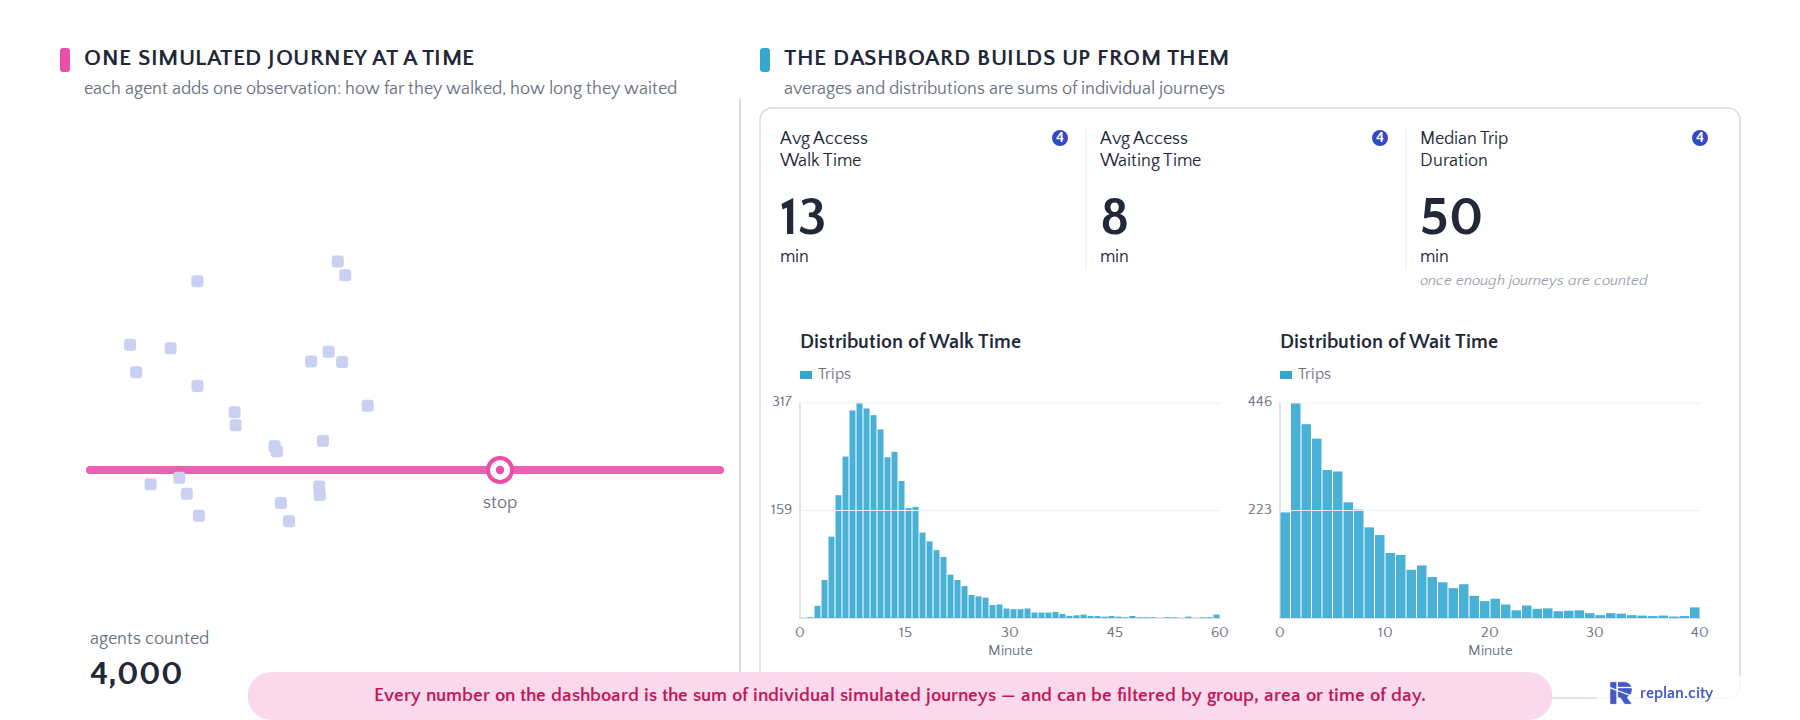
From individual journeys to dashboard statistics
Every number on the dashboard is the sum of individual simulated journeys — and can be filtered by group, area or time of day.