
All explainers · Reading a transit network
Line duplication: what it costs, what it gives, how to measure it
Animation paused (reduced motion). Press play to watch.
In one sentence
Overlap is the normal state of a bus network. Before removing it, measure it by connection and by frequency — down to the individual rider.
Why it matters
Almost every network brief lists “parallel running” as a defect, yet overlap is the normal state of a bus network: in London two or more routes serve about 40 % of origin–destination pairs, and Chinese cities commonly run three or more routes per street. The overlap is a trade. The operator pays with vehicles, with buses arriving together at shared stops, and with two timetables to coordinate; the passenger gains shorter waits where lines add up, a direct trip from either branch, and a second option when one line fails.
Barzegari, Taubkin, Barsukov and Nourinejad (2026) give the concept the precision a planner needs. They separate route-segment duplication (vehicles on the same road) from passenger-connection duplication (the same stop-to-stop connection offered by different routes, even on different streets), take the route variant — line, alternative, direction — as the unit, and weight each variant by its trips per hour against the strongest one on the segment: a 12-trips-an-hour line and a 1-trip-an-hour line on one street are not “two lines” but a duplication of 1.08. Measured by the connections passengers can actually use, duplication comes out an order of magnitude lower than the map suggests — an express variant may cover 100 % of a trajectory and 4–7 % of its connections — and it changes between peak and off-peak.
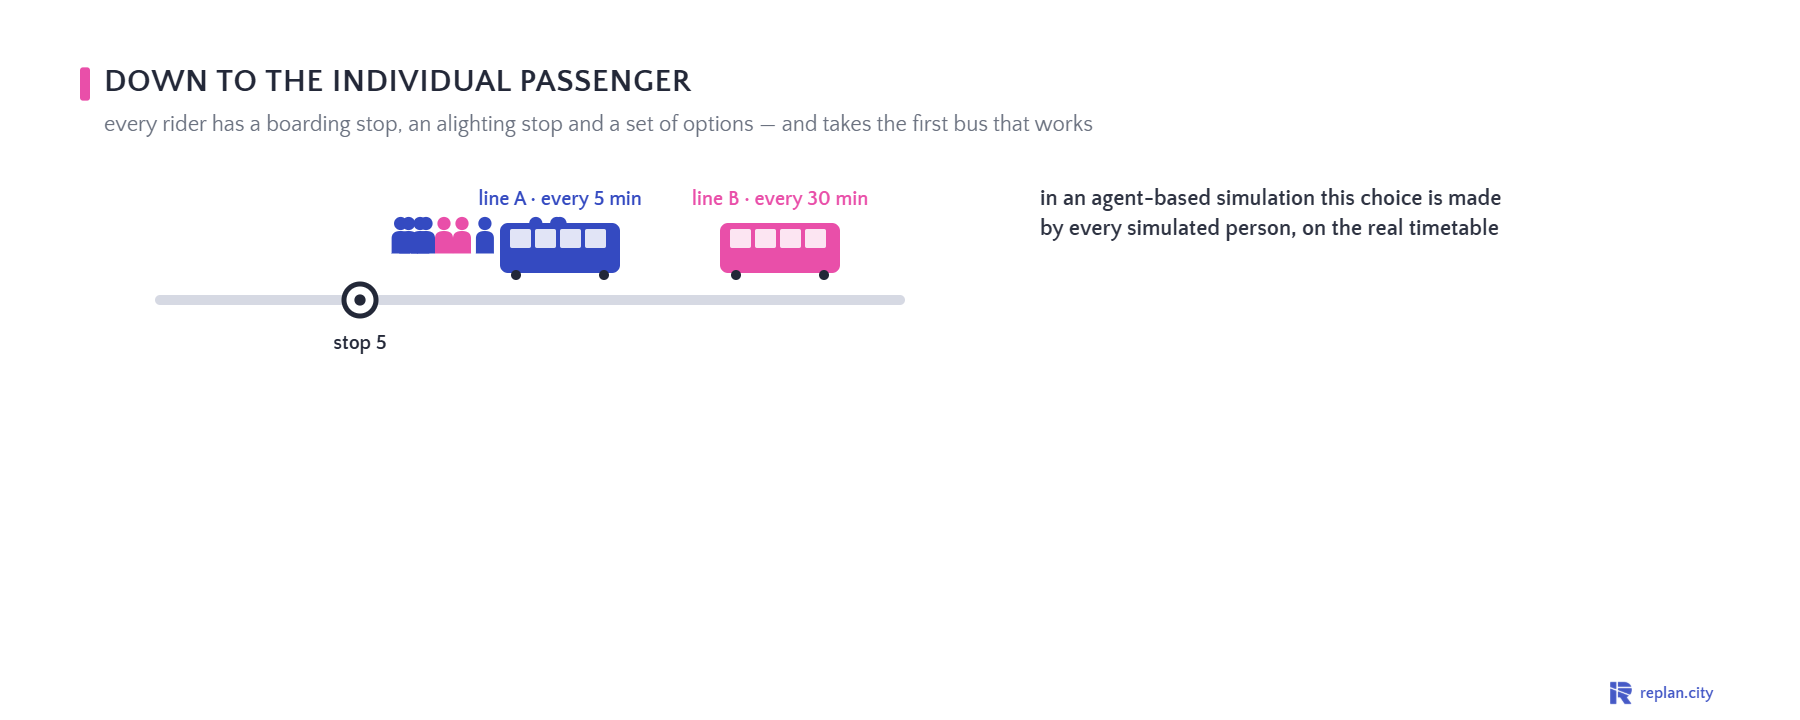
The last step is the individual rider: a boarding stop, an alighting stop, a set of options, and the first bus that works. An agent-based simulation makes that choice for every simulated person on the real timetable, so duplication becomes measurable as the riders each variant wins, the connections only one variant provides, and the riders lost when a variant is shortened.
Sources
- Barzegari, V., Taubkin, G., Barsukov, P. & Nourinejad, M. (2026). A comprehensive analysis of duplication in public transportation. Transportation Research Part A: Policy and Practice, 204, 104747. doi:10.1016/j.tra.2025.104747 (open access, CC BY 4.0) — definitions, the frequency-weighted metric and the passenger-connection view.
- Overlap figures for Harbin, Seoul and London as cited there: Feng et al. (2016), Seo et al. (2020), Martinez & Eduardo (2012).
- Vuchic, V. R. (2005). Urban Transit: Operations, Planning and Economics. Wiley. · Walker, J. (2012). Human Transit. Island Press, ch. 12.
- VDV (2019). VDV-Schrift 4: Verkehrserschließung, Verkehrsangebot und Netzqualität im ÖPNV. · FGSV (2010). EAÖ.
- Schematic illustration; corridor headways and rider shares are illustrative.
In Replan
Replan Transit runs the Lambda operation PT Service Overlap: every section where lines run parallel at short intervals, with length and combined headway, and “reduce duplication” is one objective when network alternatives are generated. Replan SIM assigns every simulated rider to a variant on the real timetable, so the shared segment shows loads per line, the connections only one variant provides, and the riders lost when a variant is shortened.
What you see
- 00.0Two lines, one street
- 09.0What it costs, what it gives
- 19.0Two kinds of duplication
- 29.0Frequency, not just geometry
- 40.0Down to the individual passenger
- 52.0In Replan
Use this explainer
Poster (PNG) · MP4 / GIF: rendered on request
Embed: <iframe src="https://www.replan.city/explains/embed/line-duplication?lang=en" width="900" height="360" style="border:0;max-width:100%;aspect-ratio:5/2" loading="lazy" title="Line duplication: what it costs, what it gives, how to measure it"></iframe>
Paste into any page; the explainer plays as live SVG (no video file).
Licence: CC BY 4.0 — reuse freely with the line “Replan GmbH · replan.city/explains”. The Replan mark in the corner stays.
More: Transit service planning with Replan
See it on your own network
Book a demoRelated explainers
Bus bunching: why buses arrive in pairs
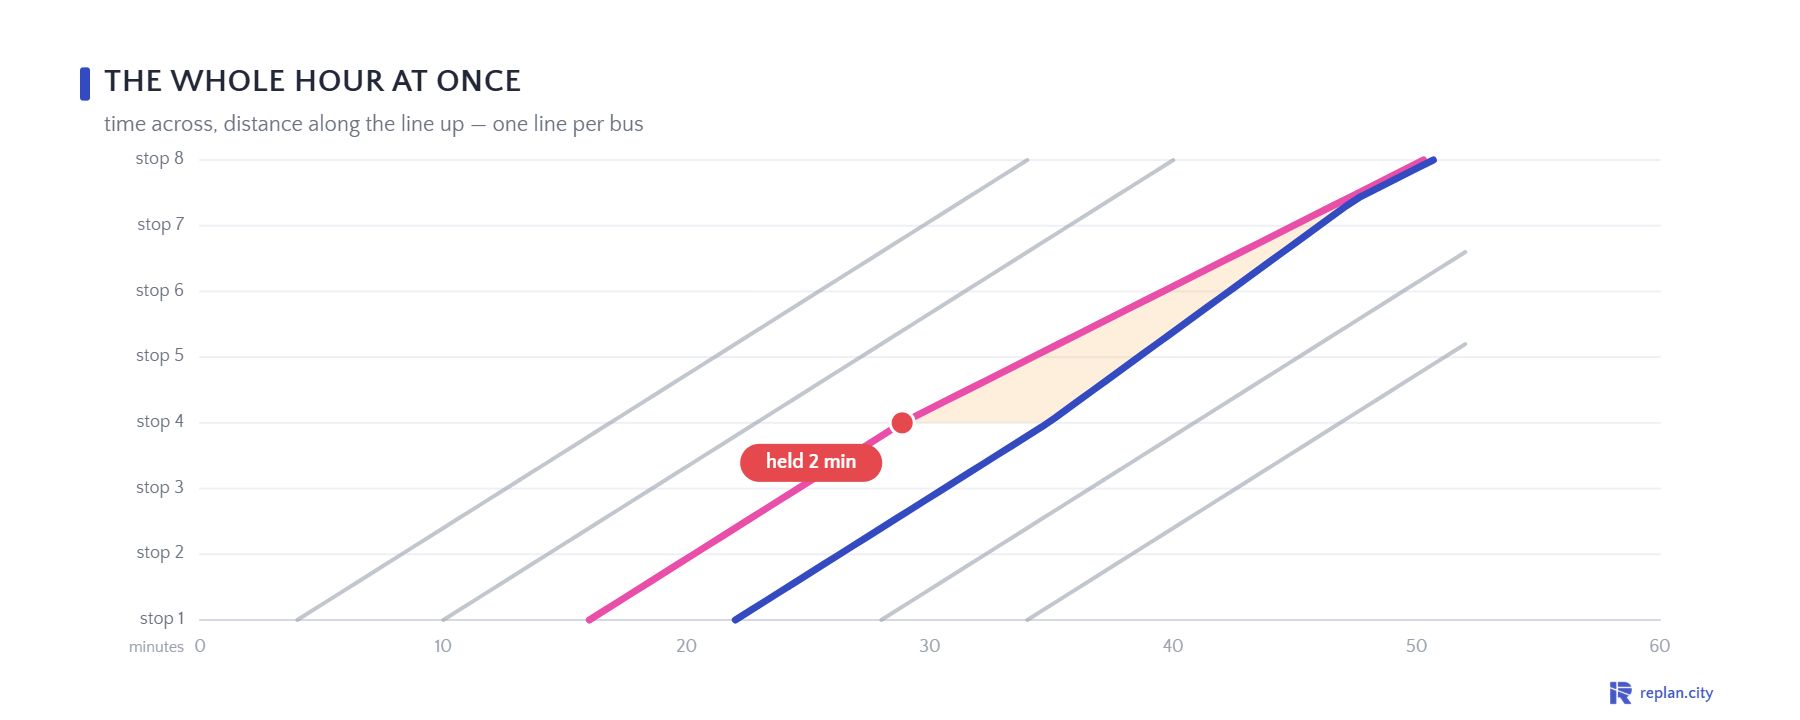
A late bus collects more passengers and gets later; the bus behind gets emptier and faster — until they run together.
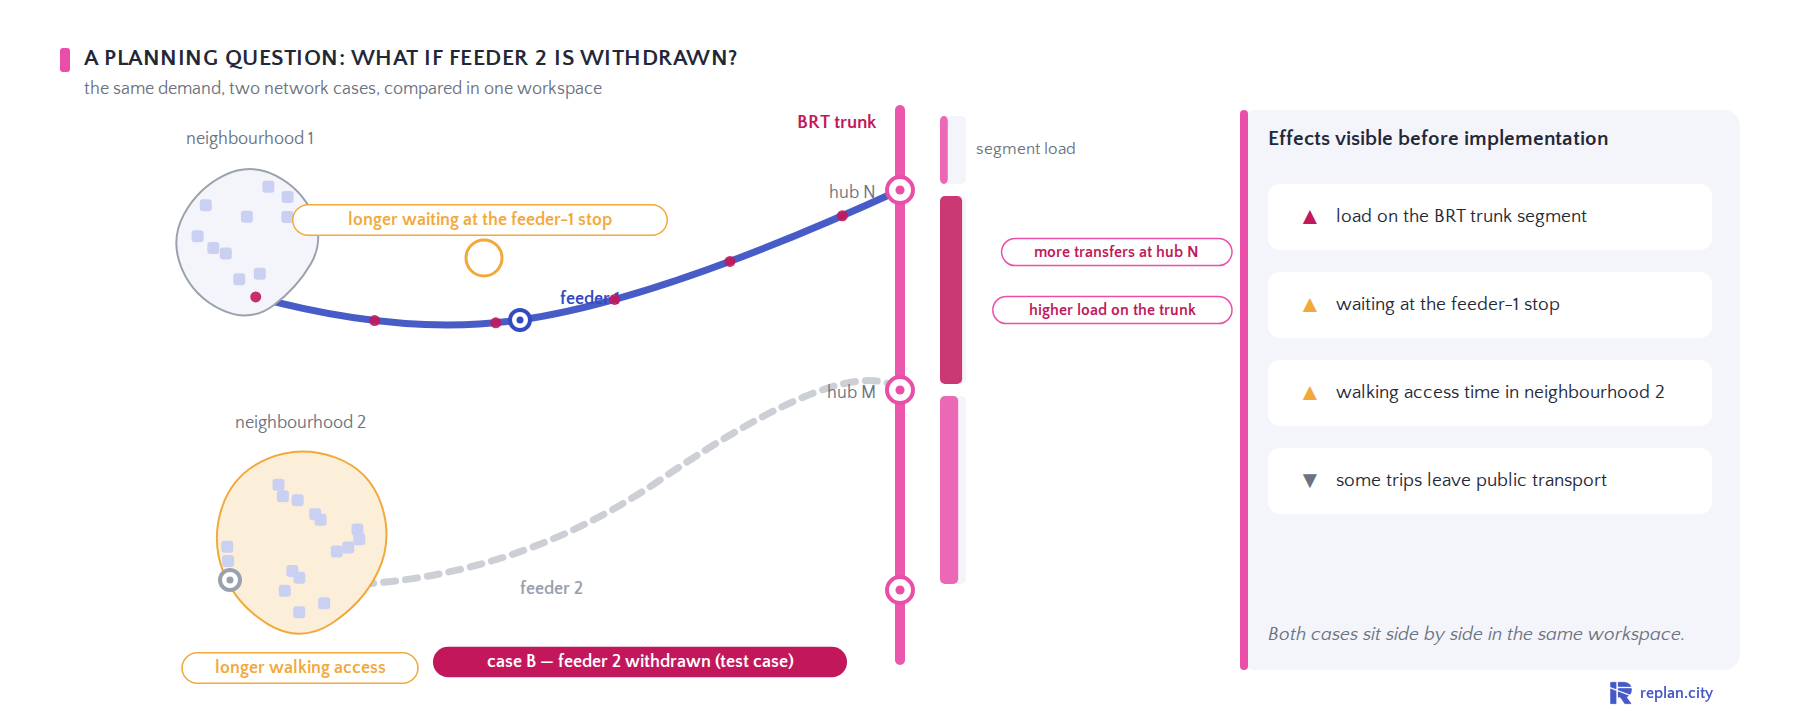
Testing a feeder change before implementation
Both cases sit side by side in the same workspace.
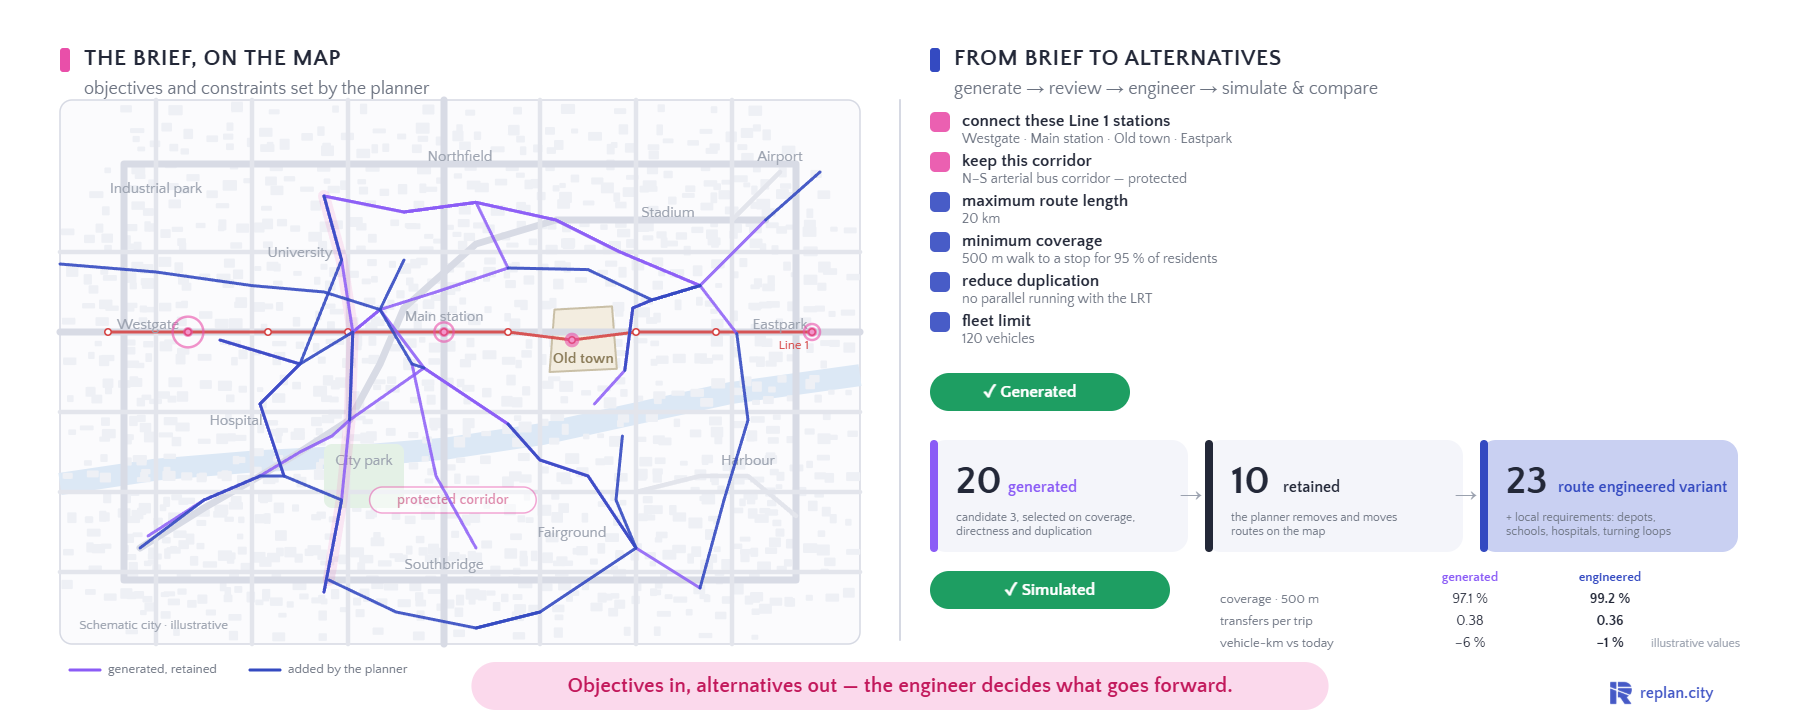
From planning objectives to network alternatives
Objectives in, alternatives out — the engineer decides what goes forward.